
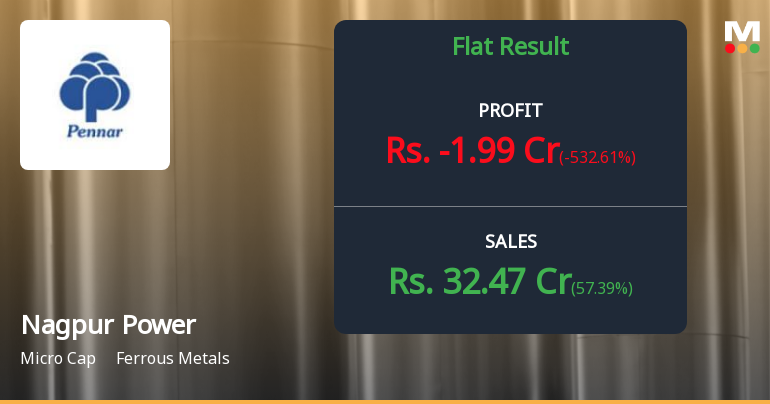
Nagpur Power Q4 FY26: Profit Turns to Loss as Operational…
Net Loss (Q4 FY26)
₹1.99 Cr
▼ 532.61% QoQ
Revenue (Q4 FY26)
₹32.47 Cr
▲ 57.39% QoQ
Operating Margin
7.45%
vs 14.08% YoY
Return on Equity
3.24%
Latest Quarter
The quarter’s results reveal a troubling disconnect between top-line growth and bottom-line performance. Whilst net sales reached their highest quarterly level at ₹32.47 crores, representing an 86.61% year-on-year increase, the company’s profitability metrics deteriorated sharply. The PAT margin collapsed to negative 6.13% from 11.15% in the year-ago quarter, whilst operating margin excluding other income stood at 7.45%, significantly below the 14.08% recorded in March 2025.
The loss-making quarter marks a concerning reversal for the Khandelwal Group company, which had shown signs of stabilisation in recent quarters. With institutional holdings at a mere 6.73% and the stock trading at an elevated P/E ratio of 109 times, investor confidence appears fragile at best.
Financial Performance: Revenue Growth Masks Profitability Crisis
Nagpur Power’s Q4 FY26 financial performance presents a paradox of strong revenue growth accompanied by severe margin compression. Net sales of ₹32.47 crores marked the highest quarterly revenue in the company’s recent history, driven by a 57.39% sequential increase and an impressive 86.61% year-on-year expansion. However, this top-line momentum failed to translate into profitability, as the company swung to a net loss of ₹1.99 crores from a profit of ₹0.46 crores in Q3 FY26.
| Quarter | Revenue (₹ Cr) | QoQ Growth | Net Profit (₹ Cr) | PAT Margin |
|---|---|---|---|---|
| Mar’26 | 32.47 | +57.39% | -1.99 | -6.13% |
| Dec’25 | 20.63 | +34.14% | 0.46 | 2.23% |
| Sep’25 | 15.38 | -1.66% | -0.99 | -6.44% |
| Jun’25 | 15.64 | -10.11% | 0.39 | 2.49% |
| Mar’25 | 17.40 | +20.33% | 1.94 | 11.15% |
| Dec’24 | 14.46 | -20.02% | -2.62 | -18.12% |
| Sep’24 | 18.08 | — | 2.82 | 15.60% |
The margin compression story is particularly concerning. Operating profit before depreciation, interest, tax, and other income (PBDIT excluding OI) stood at ₹2.42 crores, yielding a margin of just 7.45%, down sharply from 14.08% in the year-ago quarter. This deterioration suggests rising input costs or operational inefficiencies that are eroding the company’s pricing power in the ferrous metals market.
A deeper examination of the cost structure reveals multiple pressure points. Employee costs surged to ₹6.68 crores in Q4 FY26 from ₹4.94 crores in Q4 FY25, representing a 35.22% year-on-year increase that outpaced revenue growth. Interest expenses nearly doubled to ₹1.18 crores from ₹0.70 crores year-on-year, reflecting both higher debt levels and potentially elevated borrowing costs. Depreciation expenses also tripled to ₹2.30 crores from ₹0.73 crores, likely reflecting recent capital investments that have yet to generate commensurate returns.
Net Sales (Q4 FY26)
₹32.47 Cr
▲ 57.39% QoQ | ▲ 86.61% YoY
Net Profit (Q4 FY26)
₹-1.99 Cr
▼ 532.61% QoQ | ▼ 202.58% YoY
Operating Margin (Excl OI)
7.45%
vs 14.08% in Mar’25
PAT Margin
-6.13%
vs 11.15% in Mar’25
The quality of earnings also raises red flags. Other income turned negative at ₹-0.68 crores in Q4 FY26, compared to ₹1.22 crores in the year-ago quarter, suggesting potential write-offs or losses on non-operating activities. The company’s tax rate of negative 14.37% reflects the loss-making status, providing no relief to the bottom line.
Operational Challenges: Weak Returns and Mounting Debt Burden
Beyond the quarterly volatility, Nagpur Power’s fundamental operational metrics paint a picture of a company struggling to generate adequate returns on capital. The company’s Return on Equity (ROE) stands at a meagre 3.24% in the latest quarter, with an average ROE of just 3.21% over the assessment period. This anaemic return significantly lags industry standards and suggests the company is failing to efficiently deploy shareholder capital to generate profits.
Critical Profitability Concerns
Return on Capital Employed (ROCE): The company’s average ROCE of negative 3.73% indicates it is destroying value rather than creating it. The latest ROCE of 0.32% shows marginal improvement but remains far below acceptable thresholds for a manufacturing enterprise.
EBIT to Interest Coverage: At negative 1.58 times on average, the company’s operating profits are insufficient to cover interest obligations, raising concerns about financial sustainability and debt servicing capacity.
The balance sheet reveals a company under increasing financial stress. Long-term debt increased to ₹3.03 crores in March 2025 from ₹0.78 crores in March 2024, representing a near four-fold increase. Whilst the absolute debt levels remain modest, the debt to EBITDA ratio of 4.65 times suggests the company would require nearly five years of current EBITDA to repay its debt, assuming all cash flow were directed towards debt reduction.
Working capital management presents another area of concern. Cash flow from operations turned sharply negative at ₹-9.00 crores in FY25, driven by adverse changes in working capital of ₹-12.00 crores. This suggests the company is tying up increasing amounts of capital in inventory and receivables, potentially reflecting slower collections or inventory build-up that could indicate weakening demand conditions.
The company’s fixed assets increased to ₹55.83 crores in March 2025 from ₹55.67 crores, suggesting ongoing capital expenditure. However, the sales to capital employed ratio of just 0.43 times indicates poor asset utilisation, with each rupee of capital employed generating less than half a rupee in sales. This inefficiency in asset deployment raises questions about the company’s capacity planning and market positioning.
Industry Context: Underperforming the Ferrous Metals Recovery
The ferrous metals sector has witnessed robust demand conditions over the past year, driven by infrastructure spending and manufacturing activity. However, Nagpur Power has conspicuously failed to capitalise on this favourable environment. Over the one-year period, the stock delivered returns of 18.79%, significantly underperforming the Ferrous Metals sector index which gained 63.01%, resulting in a negative alpha of 44.22 percentage points.
This underperformance becomes even more pronounced when examining the company’s operational trajectory. Whilst peer companies in the ferrous metals space have reported expanding margins and improved profitability, Nagpur Power has struggled with volatile earnings and inconsistent operational performance. The company’s specialisation in low ferro manganese production through slag recovery represents a niche within the broader ferrous metals industry, potentially limiting its ability to benefit from broader sectoral tailwinds.
Market Positioning Challenges
Nagpur Power operates in the metal recovery segment, processing manganese slag to produce low ferro manganese. However, the company has acknowledged that “there is no more re-usable waste of fine particles remaining in the manganese slag which was dumped at various places at the factory site which can be recovered.” This statement raises questions about the sustainability of the company’s core business model and its ability to maintain feedstock supply for its recovery operations.
The company’s micro-cap status, with a market capitalisation of just ₹202 crores, limits its access to growth capital and institutional investor interest. Institutional holdings stand at a mere 6.73%, with no participation from foreign institutional investors or mutual funds. Insurance companies hold 6.64%, whilst other domestic institutional investors account for just 0.09%. This lack of institutional interest reflects scepticism about the company’s growth prospects and operational capabilities.
Peer Comparison: Valuation Premium Unjustified by Fundamentals
A comparative analysis with peers in the ferrous metals sector reveals Nagpur Power trading at a significant valuation premium that appears unjustified by its underlying fundamentals. The company’s P/E ratio of 108.55 times is nearly four times the peer group average, whilst its ROE of 3.21% is substantially lower than most competitors.
| Company | P/E (TTM) | ROE (%) | P/BV | Debt/Equity |
|---|---|---|---|---|
| Nagpur Power | 108.55 | 3.21% | 2.30 | -0.02 |
| Neetu Yoshi | 27.76 | 36.93% | 10.19 | 0.78 |
| Manaksia Steels | 11.18 | 8.55% | 1.37 | 0.24 |
| Vraj Iron | 13.26 | 8.13% | 1.03 | -0.01 |
| Scan Steels | 10.49 | 5.01% | 0.52 | 0.15 |
| Vaswani Industries | 64.03 | 6.49% | 1.30 | 1.61 |
The comparison reveals Nagpur Power’s fundamental weaknesses. Whilst the company benefits from a net cash position (debt to equity of negative 0.02), this advantage is offset by poor capital efficiency. Neetu Yoshi, for instance, generates an ROE of 36.93% whilst trading at a P/E of just 27.76 times, offering far superior value. Even Manaksia Steels and Vraj Iron, with ROE figures of 8.55% and 8.13% respectively, deliver better returns on equity whilst trading at single-digit P/E multiples.
The Price-to-Book ratio of 2.30 times for Nagpur Power appears reasonable in isolation but becomes concerning when considered alongside the low ROE. Companies trading at similar or lower P/BV multiples, such as Manaksia Steels (1.37x) and Vraj Iron (1.03x), generate significantly higher returns on equity, suggesting they offer better value propositions for investors seeking exposure to the ferrous metals sector.
Valuation Analysis: Expensive on All Metrics
Nagpur Power’s current valuation appears stretched across multiple parameters, earning an “Expensive” rating from valuation assessment frameworks. The company’s enterprise value to EBITDA multiple of 67.48 times and EV to EBIT ratio of 154.92 times are extraordinarily elevated, reflecting market expectations that appear disconnected from operational realities.
P/E Ratio (TTM)
108.55x
vs Industry 13x
Price to Book
2.30x
Book Value: ₹64.88
EV/EBITDA
67.48x
Highly Elevated
Mojo Score
38/100
SELL Category
The P/E ratio of 108.55 times stands in stark contrast to the industry average of 13 times, suggesting the stock is trading at more than eight times the sector valuation despite delivering inferior returns on equity and inconsistent profitability. This premium appears unjustified, particularly given the company’s recent swing to losses and deteriorating margins.
The PEG ratio of 0.44, whilst appearing attractive on the surface, is misleading. This metric, which divides the P/E ratio by the earnings growth rate, can produce deceptively low values when applied to companies with volatile or negative earnings. Given Nagpur Power’s inconsistent profitability track record, the PEG ratio provides limited insight into fair value.
The stock’s position relative to its 52-week range offers some context for current valuation levels. Trading at ₹149.85, the stock sits 15.34% below its 52-week high of ₹177.00 but remains 86.94% above its 52-week low of ₹80.16. This suggests the stock has retraced from recent highs but continues to trade at elevated levels relative to its historical range, potentially reflecting optimism that the recent quarterly loss represents a temporary setback rather than a structural deterioration.
Shareholding: Stable Base but Minimal Institutional Interest
The shareholding pattern for Nagpur Power has remained remarkably stable over the past five quarters, with no changes across any investor category. Promoter holding stands firm at 61.23%, demonstrating continued commitment from the controlling Khandelwal family and associated entities. The largest promoter entity, Zeppelin Investment Private Limited, holds 43.08%, whilst individual promoters including Gautam P Khandelwal (5.63%) and Geeta P Khandelwal (4.39%) account for the remainder.
| Category | Mar’26 | Dec’25 | Sep’25 | Jun’25 | QoQ Change |
|---|---|---|---|---|---|
| Promoter | 61.23% | 61.23% | 61.23% | 61.23% | — |
| FII | 0.00% | 0.00% | 0.00% | 0.00% | — |
| Mutual Funds | 0.00% | 0.00% | 0.00% | 0.00% | — |
| Insurance | 6.64% | 6.64% | 6.64% | 6.64% | — |
| Other DII | 0.09% | 0.09% | 0.09% | 0.09% | — |
| Non-Institutional | 32.04% | 32.04% | 32.04% | 32.04% | — |
The complete absence of foreign institutional investors and mutual funds is particularly noteworthy. This lack of participation from sophisticated institutional investors suggests limited confidence in the company’s growth trajectory and governance standards. Insurance companies hold 6.64%, representing the bulk of institutional ownership, whilst other domestic institutional investors account for a negligible 0.09%.
Non-institutional investors, primarily comprising retail shareholders and non-institutional entities, hold 32.04% of the equity. The static nature of this shareholding pattern, with zero movement across all categories for five consecutive quarters, suggests limited trading interest and poor liquidity. This stability could be interpreted positively as reflecting a committed shareholder base, or negatively as indicating a lack of investor interest and price discovery.
The absence of promoter pledging is a positive factor, eliminating concerns about forced selling or financial distress at the promoter level. However, the lack of institutional buying despite this clean pledge status reinforces concerns about the company’s fundamental attractiveness as an investment proposition.
Stock Performance: Impressive Long-Term Gains Mask Recent Weakness
Nagpur Power’s stock price performance presents a study in contrasts, with exceptional long-term returns offset by recent underperformance and elevated volatility. Over the past five years, the stock has delivered remarkable returns of 368.28%, vastly outperforming the Sensex’s 45.41% gain and generating an alpha of 322.87 percentage points. The ten-year return of 457.06% similarly dwarfs the Sensex return of 180.55%, positioning the stock amongst the top performers in the micro-cap universe over this extended timeframe.
| Period | Stock Return | Sensex Return | Alpha |
|---|---|---|---|
| 1 Week | +2.32% | -0.85% | +3.17% |
| 1 Month | -4.03% | -3.51% | -0.52% |
| 3 Month | -0.27% | -8.01% | +7.74% |
| 6 Month | +70.38% | -12.75% | +83.13% |
| YTD | -6.26% | -12.26% | +6.00% |
| 1 Year | +18.79% | -8.40% | +27.19% |
| 3 Years | +120.37% | +18.98% | +101.39% |
| 5 Years | +368.28% | +45.41% | +322.87% |
However, recent performance reveals cracks in this impressive track record. The stock has declined 6.26% year-to-date, underperforming the Sensex’s 12.26% decline by generating a positive alpha of just 6.00%. Over the one-month period, the stock fell 4.03%, marginally underperforming the Sensex’s 3.51% decline. The six-month return of 70.38% appears impressive but must be contextualised against the stock’s journey from its 52-week low of ₹80.16 in late 2025.
The stock’s volatility profile raises significant concerns for risk-averse investors. With an annualised volatility of 55.52% over the one-year period, Nagpur Power exhibits nearly four times the volatility of the Sensex (13.06%). This elevated volatility, combined with a beta of 1.50, classifies the stock as “High Beta” and “High Risk High Return,” making it suitable only for investors with substantial risk tolerance and long investment horizons.
Technical indicators present a mixed picture. The stock currently trades in a “Mildly Bullish” trend, having changed from “Bullish” on April 30, 2026, at ₹153.05. However, weekly technical indicators show “Mildly Bearish” signals from MACD, Bollinger Bands, KST, and Dow Theory, suggesting potential near-term weakness. The stock trades below key moving averages including the 5-day (₹151.59), 20-day (₹146.78), 50-day (₹152.28), 100-day (₹152.00), and 200-day (₹125.17) averages, indicating technical overhead resistance.
Investment Thesis: Deteriorating Fundamentals Override Historical Performance
The investment case for Nagpur Power rests on shaky foundations, with deteriorating fundamental performance overshadowing the stock’s impressive long-term price appreciation. The company’s Mojo Score of 38 out of 100 places it firmly in the “SELL” category, reflecting concerns across multiple parameters including valuation, quality, and recent financial trends.
Valuation Grade
EXPENSIVE
Premium Unjustified
Quality Grade
BELOW AVERAGE
Weak ROE of 3.21%
Financial Trend
FLAT
Inconsistent Performance
Technical Trend
MILDLY BULLISH
Mixed Signals
The valuation assessment of “Expensive” reflects the disconnect between the company’s elevated trading multiples and its underlying operational performance. Trading at 108.55 times earnings and 67.48 times EBITDA, the stock commands premium valuations typically reserved for high-growth, high-quality businesses. Nagpur Power’s profile of inconsistent profitability, weak returns on capital, and deteriorating margins does not justify such rich multiples.
The quality grade of “Below Average” stems from fundamental weaknesses in capital efficiency and profitability. An average ROE of 3.21% and average ROCE of negative 3.73% indicate the company is failing to generate adequate returns for shareholders. The EBIT to interest coverage of negative 1.58 times raises concerns about the company’s ability to service its debt obligations from operating profits, whilst the debt to EBITDA ratio of 4.65 times suggests elevated leverage relative to cash generation capacity.
The “Flat” financial trend designation reflects the company’s inconsistent quarterly performance, characterised by alternating profits and losses. Whilst Q4 FY26 revenue reached record levels, the swing to a net loss of ₹1.99 crores demonstrates the company’s inability to convert top-line growth into sustainable bottom-line performance. This earnings volatility makes financial forecasting challenging and reduces confidence in management’s ability to execute consistently.
Key Strengths & Risk Factors
KEY STRENGTHS ✓
- Strong Long-Term Returns: Five-year stock returns of 368.28% demonstrate significant wealth creation over extended periods
- Net Cash Position: Debt to equity of negative 0.02 indicates the company maintains a net cash position, eliminating immediate solvency concerns
- Zero Promoter Pledging: Absence of pledged shares removes concerns about forced selling or financial distress at promoter level
- Stable Promoter Holding: Consistent 61.23% promoter stake demonstrates long-term commitment from controlling shareholders
- Revenue Growth Momentum: Q4 FY26 revenue of ₹32.47 crores represents highest quarterly sales, showing top-line expansion capability
- Niche Market Position: Specialisation in slag recovery and low ferro manganese production provides differentiated business model
KEY CONCERNS ⚠
- Profitability Crisis: Q4 FY26 net loss of ₹1.99 crores marks sharp reversal from profitability, raising concerns about operational sustainability
- Weak Return on Equity: ROE of just 3.21% indicates poor capital efficiency and inability to generate adequate shareholder returns
- Negative ROCE: Average ROCE of negative 3.73% suggests value destruction rather than creation from deployed capital
- Margin Compression: Operating margin contracted to 7.45% from 14.08% year-on-year, reflecting deteriorating pricing power or cost management
- Expensive Valuation: P/E of 108.55x represents significant premium to industry average of 13x without corresponding quality or growth justification
- Zero Institutional Interest: Complete absence of FII and mutual fund holdings signals lack of confidence from sophisticated investors
- High Volatility: Annualised volatility of 55.52% and beta of 1.50 makes the stock unsuitable for risk-averse investors
Outlook: Critical Monitoring Points for Investors
POSITIVE CATALYSTS
- Return to profitability in Q1 FY27 with margins above 10%
- Successful cost rationalisation bringing employee costs below 20% of revenue
- Improvement in ROE above 8% indicating better capital deployment
- Entry of institutional investors (mutual funds or insurance companies) signalling confidence
- Sustained quarterly revenue above ₹30 crores demonstrating market acceptance
RED FLAGS
- Second consecutive quarter of losses indicating structural rather than cyclical issues
- Further deterioration in operating margins below 5%
- Increase in debt levels or debt to equity ratio turning positive
- Decline in promoter holding or emergence of promoter pledging
- Revenue falling below ₹20 crores quarterly suggesting demand weakness
- Continued absence of institutional investor participation
The path forward for Nagpur Power hinges critically on management’s ability to restore profitability whilst maintaining revenue momentum. The company must address the fundamental disconnect between top-line growth and bottom-line performance, focusing on cost optimisation and operational efficiency improvements. Investors should closely monitor the Q1 FY27 results, due in the coming months, for evidence of a return to profitability and margin recovery.
The broader industry environment for ferrous metals remains supportive, with infrastructure development and manufacturing activity providing demand tailwinds. However, Nagpur Power’s ability to capitalise on these favourable conditions depends on resolving its operational challenges and improving capital efficiency. The company’s specialised focus on slag recovery may limit its addressable market, necessitating either market share gains or diversification into adjacent product lines to drive sustainable growth.
The Verdict: Avoid Until Operational Turnaround Evident
SELL
Score: 38/100
For Fresh Investors: Avoid initiating positions given expensive valuation (P/E 108.55x), weak profitability metrics (ROE 3.21%), and recent swing to losses. The stock’s high volatility (55.52%) and lack of institutional interest compound the risk. Wait for evidence of sustained profitability recovery and margin improvement before considering entry.
For Existing Holders: Consider reducing positions or exiting entirely, particularly if holding unrealised gains from the stock’s strong long-term performance. The deteriorating fundamental trajectory, expensive valuation, and lack of earnings visibility create an unfavourable risk-reward profile. Those maintaining positions should implement strict stop-losses and closely monitor Q1 FY27 results for signs of turnaround.
Fair Value Estimate: ₹95-105 (35-40% downside from current levels), based on normalised earnings of ₹2 crores annually and a more reasonable P/E multiple of 15-20x reflecting the company’s quality grade and growth profile.
Note- ROCE = (EBIT – Other income)/(Capital Employed – Cash – Current Investments)
⚠️ Investment Disclaimer
This article is for educational and informational purposes only and should not be construed as financial advice. Investors should conduct their own due diligence, consider their risk tolerance and investment objectives, and consult with a qualified financial advisor before making any investment decisions. Past performance is not indicative of future results. Investments in micro-cap stocks carry substantial risks including high volatility, limited liquidity, and potential for total loss of capital.
 20
20 584226
 20
20
 20
20